Explaining some llm-d benchmarking data
Recently I was pointed to some llm-d benchmarking data here. In particular, the following plot was pointed out: 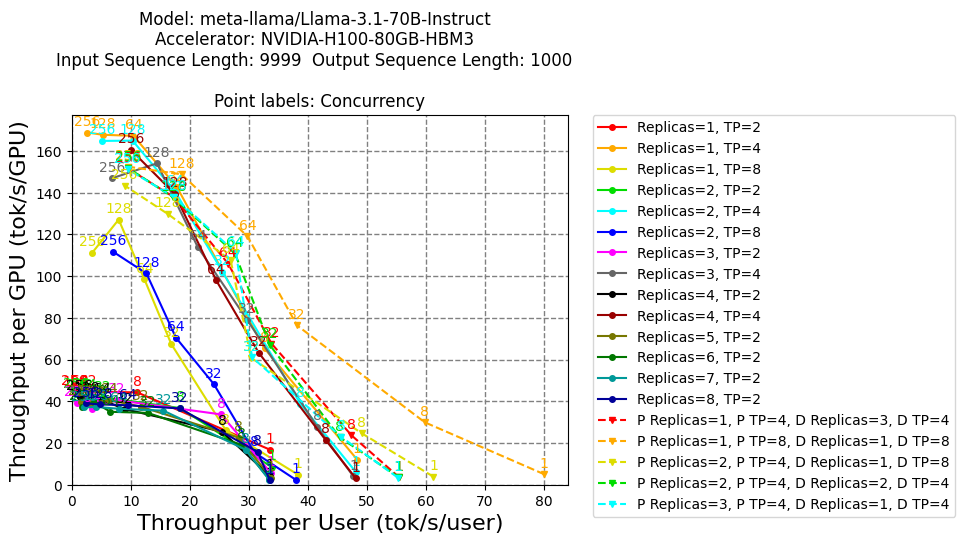 .
.
The goal here is to build some intuition for why the curves look the way they do. Disclaimer: For the sake of this exercise, I am going to ignore high-resolution details of how vLLM works and start with a low resolution toy model and then add complexity if needed. Disclaimer 2: Updates will be intermittent and this is still in progress.
There are several questions I would like to answer:
- Why do the curves in the lower-left corner have the Pareto-like shape that they do?
- For non-PD curves (solids not dashed), why is TP4 (the solid lines overlapping with PD) better than TP8 (the overlapping yellow and blue curves) which, in turn, are better than all the TP2 curves?
- For all the points with concurrency=1 (is concurrency the same as number of users?) i.e. the points labeled by “1”, can we explain the absolute values of throughput values?
Crude Model
Let’s assume we have TP (tensor parallelism) = N. This means the weights are sharded (split between) N GPUs. These N GPUs ideally have high-speed links between them. I am going to assume all 8 GPUs are on the same NVLink domain but this might not be the case. The hardware used is not clear from the notebook.
vLLM does both row parallel and column parallel sharding and alternates them in subsequent layers to keep communication to a minimum and keep partial computations local to a GPU. I plan to write a more detailed note about this. At this stage, I’ll (wrongly) assume that an all-gather is run to reconstitute the matrices for the forward passes before freeing the memory. The all-gather for layer l+1 can be overlapped with computation for layer l to minimize delays due to network latencies and bandwidths.
In this simplified model, when a user request comes in, one GPU e.g. GPU0 is assigned to the computation. All-gathers are used to get weight shards from all other GPUs (GPUs 1 through N-1 where TP=N). This achieves some throughput $\tau$ (tokens/sec).
If another concurrent user is added, the request can be assigned to another GPU e.g. GPU1. While network traffic goes up since both GPU0 and GPU1 (ignoring efficient all-gathers so that traffic is not doubled) can now compute and double total throughput to $2\tau$.
This can be done till one has as many concurrent requests as the amount of tensor parallelism i.e. N. The total throughput will scale to $N\tau$.
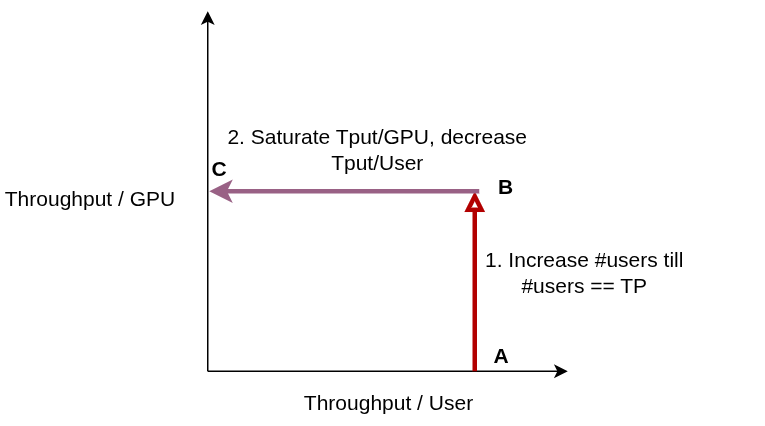
In this scenario, throughput/GPU scales linearly as each GPU actives computes and throughput/User stays constant. This is the line AB in the figure below.
 )
)
Beyond this point, as number of users are increased, absolute throughput doesn’t increase since all GPUs in the TP pool are active. Disclaimer: This is not true in general since each GPU can scale up to multiple users depending on the actual computation involved. More precisely, every GPU has an absolute max FLOPs (floating-point ops) throughput which can support several concurrent requests. We will eventually get to a more careful analysis but for a given input sequence/output sequence length distribution, instead of scaling till N concurrent users, one can imagine a multiplier $\alpha > 1$$N$ requests.
This region of constant throughput / GPU is the segment BC in the figure above. To be continued